


Boulder weather from Boulder Channel 1 News : Includes latest up to the minute weather forecasts from Nationals Weather Service in Boulder. Team coverage from Boulder Channel 1 News during Snow, and floods. See our weather on Twitter @BoulderCh1News and FaceBook Boulder Channel one. Be a weather watcher: write Boulder.BoulderChannel1@gmail.com or call News 303-447-8531
Feb 1st
To advertise please call (720) 646-6131

Apr 15th
 Inquire Boulder and dedicated phone line Expansion for Boulder Flood Info
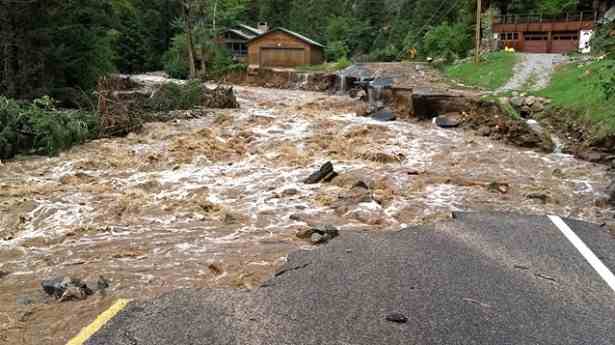
To continue to provide the most up-to-date information, resources and a dedicated contact for flood-related information, Boulder Flood Info will now have a presence on Inquire Boulder as well as a dedicated phone line.
Boulder Flood Info is the city’s comprehensive resource for all flood-related information. Currently, community members can visit www.BoulderFloodInfo.net for timely flood preparedness and recovery information or email BoulderFloodInfo@bouldercolorado.gov with questions or concerns.
With flood season upon us, expanding Boulder Flood Info was essential to provide our community with more options to get the most up-to-date information, said City Manager Jane Brautigam. We understand that community members are at very different stages of recovery and want to ensure they can get the information they need in various different ways.
Flood Info on Inquire Boulder
Inquire Boulder – the city’s virtual information desk – has been expanded to include a ‘Flood Information’ topic. This topic covers all flood-related information requests citywide. Community members can visit the Flood Information topic and make a service request. Inquire Boulder also has a specific topic dedicated to Flood Cleanup. If you have a Smartphone, residents are encouraged to download Inquire Boulder app. This app automatically geolocates service requests and provides the ability to take a picture with your device and include it with the submission.
Flood Info dedicated phone line
The Boulder Flood Info phone line, available at 303-441-1856, will be a central point of contact for residents and community members. As a citywide entry point, this phone line is a resource to answer questions as appropriate as well as route calls for department or topic-specific questions.
These additional resources should be used for informational purposes and are not intended for emergency requests. If residents feel their flood question or concern is an emergency, call 911 immediately.
Other ways to get Boulder Flood Info:
Visit www.BoulderFloodInfo.net for comprehensive, up-to-date flood-related info including:
Downloadable Community Guide to Flood Safety;
See the Flood Recovery Status Map; and
Learn about what the city is doing and what you can do to recover and prepare for flooding in Boulder.
Sign up for the Boulder Flood Info email list
Submit questions via BoulderFloodInfo@bouldercolorado.gov.
Source: City of Boulder

Feb 27th
A new study led by the University of Colorado Boulder bolsters the theory that the first Americans, who are believed to have come over from northeast Asia during the last ice age, may have been isolated on the Bering Land Bridge for thousands of years before spreading throughout the Americas.
The theory, now known as the “Beringia Standstill,” was first proposed in 1997 by two Latin American geneticists and refined in 2007 by a team led by the University of Tartu in Estonia that sampled mitrochondrial DNA from more than 600 Native Americans. The researchers found that mutations in the DNA indicated a group of their direct ancestors from Siberia was likely isolated for at least several thousand years in the region of the Bering Land Bridge, the now-submerged plain that lies between northeast Asia and Alaska once exposed by a significantly lower sea level.
CU-Boulder researcher John Hoffecker, lead author of a short paper article appearing in the Feb. 28 issue of Science magazine, said the Beringia Standstill model gained little traction outside of the genetics community after it was proposed and has been seen by some scientists outside of the field as far-fetched. But the new paper by Hoffecker and co-authors Scott Elias of Royal Holloway, University of London, and Dennis O’Rourke of the University of Utah adds credence to the Beringia Standstill idea by further linking the genetics to the paleoecological evidence.
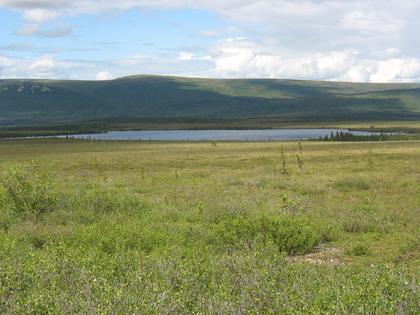
The Beringia Land Bridge was relatively temperate during the last ice age
“A number of supporting pieces have fallen in place during the last decade, including new evidence that central Beringia supported a shrub tundra region with some trees during the last glacial maximum and was characterized by surprisingly mild temperatures, given the high latitude,” said Hoffecker of CU-Boulder’s Institute of Arctic and Alpine Research. The last glacial maximum peaked roughly 21,000 years ago and was marked by the growth of vast ice sheets in North America and Europe.
While a debate rages on about when early humans first migrated into the New World, many archaeologists now believe it was sometime around 15,000 years ago after retreating glaciers opened access to coastal and interior routes into North America.
The relatively mild summer climate in Beringia at the time was caused by North Pacific circulation patterns that brought moist and relatively warm air to the region during the last glacial maximum. Geologists believe the Beringia gateway between Siberia and Alaska was more than 600 miles wide at the time.
Hoffecker and others are now theorizing that a population of hundreds or thousands of people parked itself in central Beringia for 5,000 years or more. One key to the extended occupation may have been the presence of wood in some places to use as a fuel to supplement bone, which burns hot and fast. Experiments have shown that at least some wood is necessary to make bone practical as a fuel.
Elias, a paleoecologist and also an INSTAAR affiliate, said research using fossil pollen, plant and insect material from sediment cores from the now submerged landscape show that the Bering Land Bridge tundra environment contained enough woody plants and trees like birch, willow and alder to provide a supplement to bone.
Work by Elias and others included the analysis of certain beetle species that live in very specific temperature zones, allowing them to be used as tiny thermometers. The insects indicated that temperatures there were relatively mild during last glacial maximum that ran from about 27,000 years to 20,000 years ago, only slightly cooler than temperatures in the region today.
“The climate on the land bridge and adjacent parts of Siberia and Alaska was a bit wetter than the interior regions like central Alaska and the Yukon, but not a lot warmer,” said Elias. “Our data show that woody shrubs were available on the land bridge, which would have facilitated the making of fires by the people there.”
Evidence from the 2007 study indicated a set of genetic mutations in mitochondrial DNA, which is passed down from mother to offspring, clearly accumulated after the divergence of people from their Asian parent groups in Siberia but before their dispersal throughout the Western Hemisphere, said O’Rourke. In addition, ancient DNA from human skeletal remains found at a 24,000-year-old archaeological site in southern Siberia also appears consistent with the divergence of Native American groups from their Asian forbearers by that time window, he said.
“The genetic record has been very clear for several years that the Native American genome must have arisen in an isolated population at least by 25,000 years ago, and the bulk of the migrants to the Americas really didn’t arrive south of the ice sheets until nearly 15,000 years ago,” O’Rourke said. “The paleoecological data, which I think most geneticists have not been familiar with, indicate that Beringia was not a uniform environment, and there was a shrub tundra region, or refugium, that likely provided habitats conducive to continuous human habitation.”
“From my view the genetics and paleoecology data come together nicely,” said Hoffecker, who co-authored a 2007 book with Elias titled “The Human Ecology of Beringia.” While the weakest link to the Out of Beringia theory is the lack of archaeological evidence, Hoffecker believes future research on now submerged parts of Beringia as well as lowlands in western Alaska and eastern Siberia that still remain above water may hold clues to ancient habitation by Beringia residents, who eventually moved on to be the first group to inhabit the Americas.
Hoffecker also believes that the Beringia inhabitants during the last glacial maximum could have made successful hunting forays into the uninhabited steppe-tundra region to both the east and west, where drier conditions and more grass supported a plentiful array of large grazing animals, including steppe bison, horse and mammoth.
There is now solid evidence for humans in Beringia before the last glacial maximum, as geneticists first predicted in 1997, said Hoffecker. After the maximum, there are two sets of archaeological remains dating to less than 15,000 years ago. “One represents a late migration from Asia into Alaska at that time,” he said. “The other has no obvious source outside Beringia and may represent the people who are thought to have sheltered on the land bridge during the glacial maximum.
“If we are looking for a place to put all of these people during the last glacial maximum, Beringia may be the only realistic option,” said Hoffecker.
A video news story on the research is available at http://www.colorado.edu/news.
-CU-


