


Feb 18th
Everything you have wanted to know about high winds in Boulder, and then some.
In a nut shell: In 42 years worth of data, 175 days recorded winds of 70 m.p.h. or greater. Eighty six of these occurred in December and January. The highest wind gust recorded was 137 m.p.h. on Jan. 16-17, 1982, with 20 gusts of greater than 120 m. p. h. Forty percent of all Boulder buildings sustained damage. Most of the highest winds were in south Boulder.
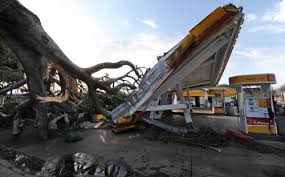
The highest wind recorded in the Boulder area was 137 mph
Boulder has some of the highest peak winds of any city in the US.
For data and tables, go to:
http://www.esrl.noaa.gov/psd/boulder/wind.html
Jan 10th
Power plants that use natural gas and a new technology to squeeze more energy from the fuel release far less of the greenhouse gas carbon dioxide than coal-fired power plants do, according to a new analysis accepted for publication Jan. 8 in Earth’s Future, a journal of the American Geophysical Union. The so-called “combined cycle” natural gas power plants also release significantly less nitrogen oxides and sulfur dioxide, which can worsen air quality.
“Since more and more of our electricity is coming from these cleaner power plants, emissions from the power sector are lower by 20, 30 even 40 percent for some gases since 1997,” said lead author Joost de Gouw, an atmospheric scientist with NOAA’s Cooperative Institute for Research in Environmental Sciences (CIRES) at the University of Colorado Boulder. NOAA is the National Oceanic and Atmospheric Administration.

The decommissioned Arapahoe power plant in south Denver.
De Gouw, who works at NOAA’s Earth System Research Laboratory (ESRL), and his NOAA and CIRES colleagues analyzed data from systems that continuously monitor emissions at power plant stacks around the country. Previous aircraft-based studies have shown these stack measurements are accurate for carbon dioxide (CO2) and for nitrogen oxides and sulfur dioxide. Nitrogen oxides and sulfur dioxide can react in the atmosphere to form tiny particles and ozone, which can cause respiratory disease.
To compare pollutant emissions from different types of power plants, the scientists calculated emissions per unit of energy produced, for all data available between 1997 and 2012. During that period of time, on average:
In combined cycle natural gas plants, operators use two heat engines in tandem to convert a higher fraction of heat into electrical energy. For context, U.S. households consumed 11,280 kilowatt hours of energy, on average, in 2011, according to the U.S. Energy Information Agency. This amounts to 11.4 metric tons per year of CO2 per household, if all of that electricity were generated by a coal power plant, or 5.4 metric tons if it all came from a natural gas power plant with combined cycle technology.
The researchers reported that between 1997 and 2012, the fraction of electric energy in the United States produced from coal gradually decreased from 83 percent to 59, and the fraction of energy from combined cycle natural gas plants rose from none to 34 percent.
That shift in the energy industry meant that power plants, overall, sent 23 percent less CO2 into the atmosphere last year than they would have, had coal been providing about the same fraction of electric power as in 1997, de Gouw said. The switch led to even greater reductions in the power sector’s emissions of nitrogen oxides and sulfur dioxide, which dropped by 40 percent and 44 percent, respectively.
The new findings are consistent with recent reports from the Energy Information Agency that substituting natural gas for coal in power generation helped lower power-related carbon dioxide emissions in 2012.
The authors noted that the new analysis is limited to pollutants emitted during energy production and measured at stacks. The paper did not address levels of greenhouse gases and other pollutants that leak into the atmosphere during fuel extraction, for example. To investigate the total atmospheric consequences of shifting energy use, scientists need to continue collecting data from all aspects of energy exploration, production and use, the authors concluded.
Authors of the new paper, “Reduced Emissions of CO2, NOx and SO2 from U.S. Power Plants Due to the Switch from Coal to Natural Gas with Combined Cycle Technology,” are de Gouw (CIRES), David Parrish (NOAA ESRL), Greg Frost (CIRES) and Michael Trainer (NOAA).
CIRES is a joint institute of NOAA and CU-Boulder.
-CU-
Nov 1st
In an example of the challenges water-strapped Western cities will face in a warming world, new research shows that every degree Fahrenheit of warming in the Salt Lake City region could mean a 1.8 to 6.5 percent drop in the annual flow of streams that provide water to the city.
By midcentury, warming Western temperatures may mean that some of the creeks and streams that help slake Salt Lake City’s thirst will dry up several weeks earlier in the summer and fall, according to the new paper, published today in the journal Earth Interactions. The findings may help regional planners make choices about long-term investments, including water storage and even land-protection policies.

Dell Creek in Parley’s Canyon, is a source of water for Salt Lake City. A new study shows how climate change is likely to affect the various creeks and streams that help slake Salt Lake City’s thirst.
“Many Western water suppliers are aware that climate change will have impacts, but they don’t have detailed information that can help them plan for the future,” said lead author Tim Bardsley, with NOAA’s Cooperative Institute for Research in Environmental Sciences (CIRES) at the University of Colorado Boulder. “Because our research team included hydrologists, climate scientists and water utility experts, we could dig into the issues that mattered most to the operators responsible for making sure clean water flows through taps and sprinklers without interruption.”
Bardsley works for the CIRES Western Water Assessment, from the NOAA Colorado Basin River Forecast Center in Salt Lake City. For the new paper, he worked closely with colleagues from the city’s water utility, the National Center for Atmospheric Research (NCAR), NOAA’s Earth System Research Laboratory and the University of Utah.
The team relied on climate model projections of temperature and precipitation in the area, historical data analysis and a detailed understanding of the region from which the city utility obtains water. The study also used NOAA streamflow forecasting models that provide information for Salt Lake City’s current water operations and management.
The picture that emerged was similar, in some ways, to previous research on the water in the Interior West: Warmer temperatures alone will cause more of the region’s precipitation to fall as rain than snow, leading to earlier runoff and less water in creeks and streams in the late summer and fall.
“Many snow-dependent regions follow a consistent pattern in responding to warming, but it’s important to drill down further to understand the sensitivity of watersheds that matter for individual water supply systems,” said NCAR’s Andy Wood, a co-author.
The specifics in the new analysis—which creeks are likely to be impacted most and soonest, how water sources on the nearby western flank of the Wasatch Mountains and the more distant eastern flank will fare—are critical to water managers with Salt Lake City.
“We are using the findings of this sensitivity analysis to better understand the range of impacts we might experience under climate change scenarios,” said co-author Laura Briefer, water resources manager at the Salt Lake City Department of Public Utilities. “This is the kind of tool we need to help us adapt to a changing climate, anticipate future changes and make sound water-resource decisions.”
“Water emanating from our local Wasatch Mountains is the lifeblood of the Salt Lake Valley, and is vulnerable to the projected changes in climate,” said Salt Lake City Mayor Ralph Becker. “This study, along with other climate adaptation work Salt Lake City is doing, helps us plan to be a more resilient community in a time of climate change.”
Among the details in the new assessment:
Authors of the new paper, “Planning for an Uncertain Future: Climate Change Sensitivity Assessment Toward Adaptation Planning for Public Water Supply,” are Tim Bardsley, CIRES Western Water Assessment; Andrew Wood, NCAR and formerly of NOAA’s Colorado Basin River Forecast Center; Mike Hobbins, NOAA’s Earth System Research Laboratory, and formerly NOAA’s Colorado Basin River Forecast Center; Tracie Kirkham, Laura Briefer, and Jeff Niermeyer, Salt Lake City Department of Public Utilities, Salt Lake City, Utah; and Steven Burian, University of Utah, Salt Lake City.
Earth Interactions is jointly published by the American Geophysical Union, the American Meteorological Society and the Association of American Geographers.
CIRES is a joint institute of NOAA and CU-Boulder.
[includeme src=”http://c1n.tv/boulder/media/bouldersponsors.html” frameborder=”0″ width=”670″ height=”300″]


