


Dec 13th
AS VOYAGER 1 NEARS EDGE OF SOLAR
SYSTEM, CU SCIENTISTS LOOK BACK
In 1977, Jimmy Carter was sworn in as president, Elvis died, Virginia park ranger Roy Sullivan was hit by lightning a record seventh time and two NASA space probes destined to turn planetary science on its head launched from Cape Canaveral, Fla.
The identical spacecraft, Voyager 1 and Voyager 2, were launched in the summer and programmed to pass by Jupiter and Saturn on different paths. Voyager 2 went on to visit Uranus and Neptune, completing the “Grand Tour of the Solar System,” perhaps the most exciting interplanetary mission ever flown. University of Colorado Boulder scientists, who designed and built identical instruments for Voyager 1 and Voyager 2, were as stunned as anyone when the spacecraft began sending back data to Earth.
The discoveries by Voyager started piling up: Twenty-three new planetary moons at Jupiter, Saturn, Uranus and Neptune; active volcanoes on Jupiter’s moon, Io; Jupiter’s ring system; organic smog shrouding Saturn’s moon, Titan; the braided, intertwined structure of Saturn’s rings; the solar system’s fastest winds (on Neptune, about 1,200 miles per hour); and nitrogen geysers spewing from Neptune’s moon, Triton.
Amazingly, both spacecraft have kept on chugging (if one can call 35,000 miles per hour chugging). NASA announced last week that Voyager 1 — about 11 billion miles from Earth — has now sailed to the edge of the solar system and is expected to punch its way into interstellar space in a time span ranging from a few months to a few years. Voyager 2 is not far behind, but on a different trajectory. –
Charlie Hord, a former planetary scientist at CU-Boulder’s Laboratory for Atmospheric and Space Physics, remembers the salad days of the Voyager program, which was managed by NASA’s Jet Propulsion Laboratory in Pasadena. Hord, the principal investigator for a time on the LASP instrument known as a photopolarimeter built for Voyager, still shakes his head in wonder as he recalls some of the discoveries.
“All of the scientists were dazzled by the pictures of the moons of Jupiter and Saturn coming back,” recalled Hord, 74, who still lives in Boulder. “To finally look at them up close was the most remarkable thing I’ve ever seen in my life.” Since the early Voyager days were pre-Internet, “We used to send people over to the JPL newsroom to steal press kits so we could look at the pictures taken by the imaging team,” he laughs.
The LASP photopolarimeter, a small telescope that measured the intensity and polarization of light at different wavelengths, was used for a variety of observations during the mission. The instrument helped scientists distinguish between rock, dust, frost, ice and meteor material. And it helped scientists determine the structure of Jupiter’s Great Red Spot, which Hord called “a giant hurricane that has blown for 200 years,” as well as the properties of the clouds and atmospheres of Jupiter, Saturn Uranus and Neptune, and Saturn’s largest moon, Titan.
The CU-Boulder instrument also was used to learn more about the makeup of the Io torus, a doughnut-shaped ring around Jupiter formed by volcanic eruptions from its moon, Io, as well as determining the distribution of ring material orbiting Saturn, Uranus and Neptune and the surface compositions of the outer planet moons.
One of the finest mission moments for Hord was analyzing the data returned from the photopolarimeter when it was locked on the star Delta Scorpii as it emerged from behind Saturn and passed behind the elegant rings in a “stellar occultation” when the light from a star is blocked by an intervening object. The processed photopolarimeter data showed each ring was made up of numerous smaller ringlets. “They were beautiful — they looked just like the grooves on a phonograph record,” he said.
On the off chance either spacecraft is encountered by an alien civilization, each are carrying what are known as “Golden Records” — gold-plated copper, audiovisual phonograph records with greetings in 54 languages, photos of people and places on Earth, the sounds of surf, wind, thunder, birds and whales, diagrams of DNA and snippets of music ranging from Bach and Beethoven to guitarist Chuck Berry’s classic rock-and-roll song, Johnny B. Goode. The spacecraft even carries a stylus set up in the correct position so that aliens could immediately play the record, named “Murmurs from Earth” by Carl Sagan, who conceived the Golden Record effort.
“I thought adding the Golden Record to the mission was a neat thing to do,” said Hord. A guitar player himself who performs jazz and Big Band music with a trio that visits Boulder retirement homes, Hord recalled that JPL threw the Voyager team a party to celebrate the end of Voyager 2’s Grand Tour as it passed by Neptune in 1989 (Pluto was in a distant part of its orbit at the time). “We even had Chuck Berry playing his guitar on the steps of the Jet Propulsion Laboratory,” he said. “It was really something.”
In 1990, Voyager 1 turned around one last time and took a portrait of the solar system — a sequence of photos that revealed six of the nine planets in an orbital dance. From nearly 4 billion miles away, Earth took up only a single pixel.
“To me, Voyager was the most fun and interesting planetary mission ever,” said Hord, who enlisted the help of then-graduate students Carol Stoker (now a NASA planetary scientist) and Wayne Pryor (now a professor at Central Arizona University) to analyze data from the mission. Over its lifetime, the CU-Boulder photopolarimeter science team also included LASP Professor Larry Esposito, Senior Research Associate Ian Stewart, retired faculty members Karen Simmons, Charles Barth and Robert West, as well as tireless work by many undergraduate and graduate students.
Esposito, who is still at LASP and is the principal investigator on a $12 million CU-Boulder instrument package aboard NASA’s Cassini Mission to Saturn, said his biggest thrill of the Voyager mission was the Neptune fly-by in 1989 when the gas giant “went from being a small blurry dot to a planet with bright clouds and numerous moons and rings. “Triton erupted before our eyes, and Neptune’s partial rings were punctuated and variable like a type of sausage that the French make.”
Then-CU President Gordon Gee was so impressed with the blue image the LASP team made of Neptune’s ring system that he used it on his Christmas cards, said Esposito, a professor in the astrophysical and planetary sciences department.
Esposito believes the biggest discovery by CU-Boulder’s Voyager photopolarimeter team was the intricate structure of Saturn’s F ring — a ring he discovered in 1979 using data from NASA’s Pioneer 11 mission. The CU-Boulder team determined the faint F ring was made up of three separate ringlets that appeared to be braided together, and that the inner and outer limits of the ring were controlled by two small “shepherd satellites.”
In addition, Esposito said that density waves — ripple-like features in the rings caused by the influence of Saturn’s moons — allowed the team to estimate the weight and age of Saturn’s rings.
As for Hord, the Casper, Wyo., native went on to be the principal investigator for two spectrometers designed for NASA’s Galileo Mission to Jupiter that launched in 1989 to tour the Jovian system, including its bizarre moons. Hord officially retired in 1997, but returns to campus for occasional visits with his colleagues.
In 40,000 years, Voyager 1 will float within 9.3 trillion miles of the star AC+793888 in the constellation Camelopardalis. In 296,000 years, Voyager 2 will pass within 25 trillion miles of Sirius, the brightest star in the sky. Perhaps on the way, the spacecraft will encounter some musically inclined aliens up for a little Bach, Beethoven or Berry.
-CU
Sep 15th
The blanket of sea ice that floats on the Arctic Ocean appears to have reached its lowest extent for 2011, the second lowest recorded since satellites began measuring it in 1979,
The Arctic sea ice extent fell to 1.67 million square miles, or 4.33 million square kilometers on Sept. 9, 2011.
While this year’s September minimum extent was greater than the all-time low in 2007, it remains significantly below the long-term average and well outside the range of natural climate variability, according to scientists involved in the analysis. Most scientists believe the shrinking Arctic sea ice is tied to warming temperatures caused by an increase in human-produced greenhouse gases pumped into Earth’s atmosphere.
“Every summer that we see a very low ice extent in September sets us up for a similar situation the following year,” said NSIDC Director Mark Serreze, also a professor in CU-Boulder’s geography department. “The Arctic sea ice cover is so thin now compared to 30 years ago that it just can’t take a hit anymore. This overall pattern of thinning ice in the Arctic in recent decades is really starting to catch up with us.”
Serreze said that in 2007, the year of record low Arctic sea ice, there was a “nearly perfect” set-up of specific weather conditions. Winds pushed in more warm air over the Arctic than usual, helping to melt sea ice, and winds also pushed the floating ice chunks together into a smaller area. “It is interesting that this year, the second lowest sea ice extent ever recorded, that we didn’t see that kind of weather pattern at all,” he said.
The last five years have been the five lowest Arctic sea ice extents recorded since satellite measurements began in 1979, said CU-Boulder’s Walt Meier, an NSIDC scientist. “The primary driver of these low sea ice conditions is rising temperatures in the Arctic, and we definitely are heading in the direction of ice-free summers,” he said. “Our best estimates now indicate that may occur by about 2030 or 2040.”
There still is a chance the sea ice extent could fall slightly due to changing winds or late season melt, said Meier. During the first week of October, CU-Boulder’s NSIDC will issue a full analysis of the 2011 results and a comparison to previous years.
NSIDC is part of CU-Boulder’s Cooperative Institute for Research in Environmental Sciences — a joint institute of CU-Boulder and the National Oceanic and Atmospheric Administration headquartered on the CU campus — and is funded primarily by NASA.
NSIDC’s sea ice data come from the Special Sensor Microwave Imager/Sounder sensor on the Defense Meteorological Satellite Program F17 satellite using methods developed at NASA’s Goddard Space Flight Center in Greenbelt, Md.
Aug 2nd
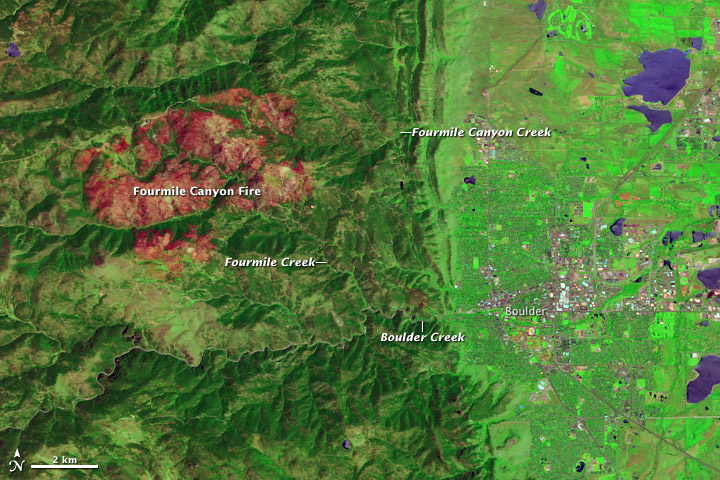
In September 2010, the Fourmile Canyon Fire broke out in the foothills west of Boulder, Colorado, scorching more than 6,000 acres (2,500 hectares) and forcing residents to evacuate. Ten months later, residents had to evacuate again, this time to flee floods. Stripped of vegetation, the slopes along Fourmile Canyon soaked up little of the water dropped by a thunderstorm. Instead, the runoff surged into local stream channels.
On June 7, 2011, the Advanced Land Imager (ALI) on NASA’s Earth Observing-1 (EO-1) satellite observed the Fourmile Canyon burn scar. The top image is made from a combination of shortwave infrared and visible light. The bottom image is natural color.
The scar is more easily detected in the false-color image, where the burned area appears in shades of red and orange. Creek valleys, which generally escaped the flames in September 2010, form winding corridors of green through the scar. To the east and southeast, the city of Boulder lies on relatively flat land.
After the fire, the U.S. Geological Survey (USGS) warned residents to prepare for the possibility of flooding, even from small rainstorms. Late on July 13, 2011, such a storm occurred. As rain fell west of Boulder, Fourmile Creek rose rapidly. In fact, at one USGS gauge, the water discharge rate skyrocketed in a matter of minutes from 10 cubic feet per second to 350 cubic feet per second. The increased water flow translated into a 4-foot (1.2-meter) surge down the creek. Smaller surges followed later that night and over the next few days.
Fourmile Creek is a tributary of Boulder Creek, which flows eastward through the city. Water levels usually peak between mid-May and early July. But thanks to the melting of an unusually heavy snowpack, water levels on Boulder Creek were especially high when the July 13 thunderstorm struck. As residents in the Fourmile burn area were ordered to evacuate low-lying homes, emergency sirens also sounded in Boulder.
By late July 2011, water levels had receded along both the Fourmile and Boulder Creeks, although water levels in both remained above normal. Colorado’s monsoon season typically lasts from about mid-July to early September, so the possibility of more flooding remains.
Because of the angle of sunlight, these images may cause an optical illusion known as relief inversion.
References
Byars, M. (2011, July 13). Heavy rains hit Fourmile, prompt evacuations along Boulder Creek. Boulder Daily Camera. Accessed July 29, 2011.
Colorado Mountain Club. Protecting Yourself from Mountain Hazards. Accessed July 29, 2011.
Colorado Water Science Center. (2011, July 13). Video From Fourmile Creek at Orodell. USGS. Accessed July 29, 2011.
Colorado’s Surface Water Conditions. (2011, July 29). Boulder Creek at Boulder, Colorado. State of Colorado. Accessed July 29, 2011.
National Water and Climate Center. (2011, July 7). Weekly Report – Snowpack/Drought Monitor Update. U.S. Department of Agriculture. Accessed July 29, 2011.
National Water Information System. (2011, July 29). USGS 06727410 Fourmile Creek at Logan Mill Road near Crisman, Colorado. USGS. Accessed July 29, 2011.
National Water Information System. (2011, July 29). USGS 06727500 Fourmile Creek at Orodell, Colorado. USGS. Accessed July 29, 2011.
News staff. (2011, July 13). Thunderstorms pound area; flood sirens sound in Boulder. The Denver Post. Accessed July 29, 2011.
Ruddy, B.C., Stevens, M.R., Verdin, K.L., and Elliott, J.G. (2010). Probability and volume of potential postwildfire debris flows in the 2010 Fourmile burn area, Boulder County, Colorado: U.S. Geological Survey Open-File Report 2010–1244. Accessed July 29, 2011.
Snider, L. (2011, June 8). Boulder Creek swells as warm weather melts snowpack. Boulder Daily Camera. Accessed July 29, 2011.
NASA Earth Observatory image created by Jesse Allen and Robert Simmon, using EO-1 ALI data provided courtesy of the NASA EO-1 team and the United States Geological Survey. Caption by Michon Scott.


